Cross-Border E-Commerce Data Analysis & Visualization: A Practical Guide
Cross-border e-commerce data analysis & visualization is the systematic process of collecting, processing, analysing and visualising data from global online shopping platforms for making strategic choices. For organisations that conduct business across borders, dealing with numerous currencies, languages, tax systems and marketplaces like Amazon, Shopee, eBay and Alibaba makes it more difficult to evaluate things like sales trends, consumer behaviour, inventory movement and how effectively advertisements perform. This article illustrates how data-driven initiatives may assist training groups, growth managers and operations teams convert raw statistics into usable information. We explore how visualisation transforms large datasets into comprehensible dashboards using practical models and real-world examples, resulting in quicker decisions, less uncertainty, and scalable solutions aligned with company objectives (McKinsey & Company, 2022).
As e-commerce grows throughout the globe, cross-border transactions are predicted to exceed $7 trillion by 2025 (Statista, 2023). These marketplaces are developing, but at the same time sellers are faced with increasing pressure to make the best decisions about what to offer, how much to spend on advertising and how to make their supply chains as efficient as possible. Teams that know how to analyse and show data can identify performance issues, forecast changes in demand, and strategically allocate assets. This article provides an in-depth manual for businesses, schools and service providers to establish strong data capabilities, whether via internal training, curriculum collaborations or white-label solutions.

Understanding Cross-Border E-Commerce Data Analysis
What Makes Cross-Border Analytics Different
Cross-border data analysis is more difficult than local e-commerce analytics because it has to deal with more than one set of rules and cultures. Sellers have to match up data from platforms that use different reporting standards, deal with changes in currency that affect their profit margins, and follow different tax rules in different places. For example, to find the real net profit, you have to take into account more than just the cost of the goods and the shipping. You also have to account for VAT/GST responsibilities, marketplace fees, exchange rate spreads, and tariff changes (International Trade Administration, 2021). Because of this, you need to have specific skills in data governance to be able to gather, standardize, and confirm data from different sources before you can do any useful research.
Core KPIs That Drive Decisions
Cross-border businesses depend on keeping an eye on the right success indicators. Conversion rates show how well you turn visitors into buyers, while traffic metrics show how people find your store. Pricing and customer retention strategies are based on the average order value and the customer lifetime value. Inventory change rates keep multiple stores from having expensive stockouts or overstocks. Metrics for advertising like click-through rate, cost-per-click, and return on ad spend show how profitable a campaign is. Besides these operational KPIs, long-term planning is also based on strategic indicators like market share growth, competitive keyword rankings, and seasonal demand patterns. Analytical skills start with knowing which measures are most important for your business plan, whether you're a brand manufacturer, distributor, or service provider.
From Raw Data to Strategic Insight
The first step in the analytical process is getting data from shipping systems, advertising screens, and platform APIs. After that comes cleaning and transformation, which includes dealing with missing values, making date formats consistent, and changing currencies. Once the data is ready, it can be analyzed using a variety of methods, such as descriptive statistics to show how things went in the past, diagnostic analysis to find out why things are going wrong, and prediction modeling to guess what will happen in the future. Then, visualization turns these results into charts, heatmaps, and dashboards that show insights right away. A well-made visual report can show that a rise in shopping cart abandonment is linked to higher shipping costs or that demand for certain types of products always goes up before regional holidays. These are insights that might not be visible in spreadsheet rows.
Choosing the Right Analytics and Visualization Tools for Cross-Border E-Commerce
Evaluating Platform Capabilities
It's important to find a balance between usefulness, ease of use, and integration freedom when choosing the right tools. Business-level tools like Tableau and Power BI have strong visualization tools and can connect to many data sources through APIs. However, they usually need to be set up by someone with technical knowledge. Setting up cloud-based analytics platforms is faster, and updates happen automatically. However, you may not be able to change many things about them. When looking at your options, give more weight to platforms that let you report in more than one currency, have bilingual interfaces (important for teams that work with both Chinese and English-speaking markets), and automatically sync data from major cross-border marketplaces without the need for manual exports. It's also important to look for security features like encryption standards, role-based access controls, and compliance certifications that are relevant to your industry.
Practical Considerations for Implementation
Different types of businesses have different budget limits. Small teams may start with built-in platform analytics and add Google Data Studio later on. Medium-sized businesses may buy flexible SaaS solutions, and large companies may create their own systems. Training time is also important to think about because tools are only useful if your team knows how to use them well. How well the system fits with your current technology stack depends on how well it can integrate with it. It should be able to get information from your ERP, CRM, and advertising accounts. Does it work with automated schedules for reporting? Browser-based platforms with B/S architecture get rid of the hassles of installation and let people work together from afar, which is especially helpful for teams that are spread out and managing operations around the world.
Tailored Solutions for Training and Operations
Companies that are working to improve their own data handling have special needs. Training platforms should have sandbox="allow-scripts allow-same-origin allow-presentation"es where students can practice analysis without changing real business data so that they can learn by doing. Guided project modules, template dashboards, and built-in case libraries are some of the features that help you learn new skills faster. The cross-border e-commerce data analysis & visualization training system from E.C.R. Academy is a good example of this method because it combines international technical standards with real-world processes that top sellers use. The browser-based platform offers complete training that includes data collection, store monitoring, advertising optimization, and report creation. You can access all of this without installing any software, and it can be used by individuals or by institutions (enteredu.com).
Implementing Data Visualization for Optimized Procurement Decisions
Building Effective Dashboards
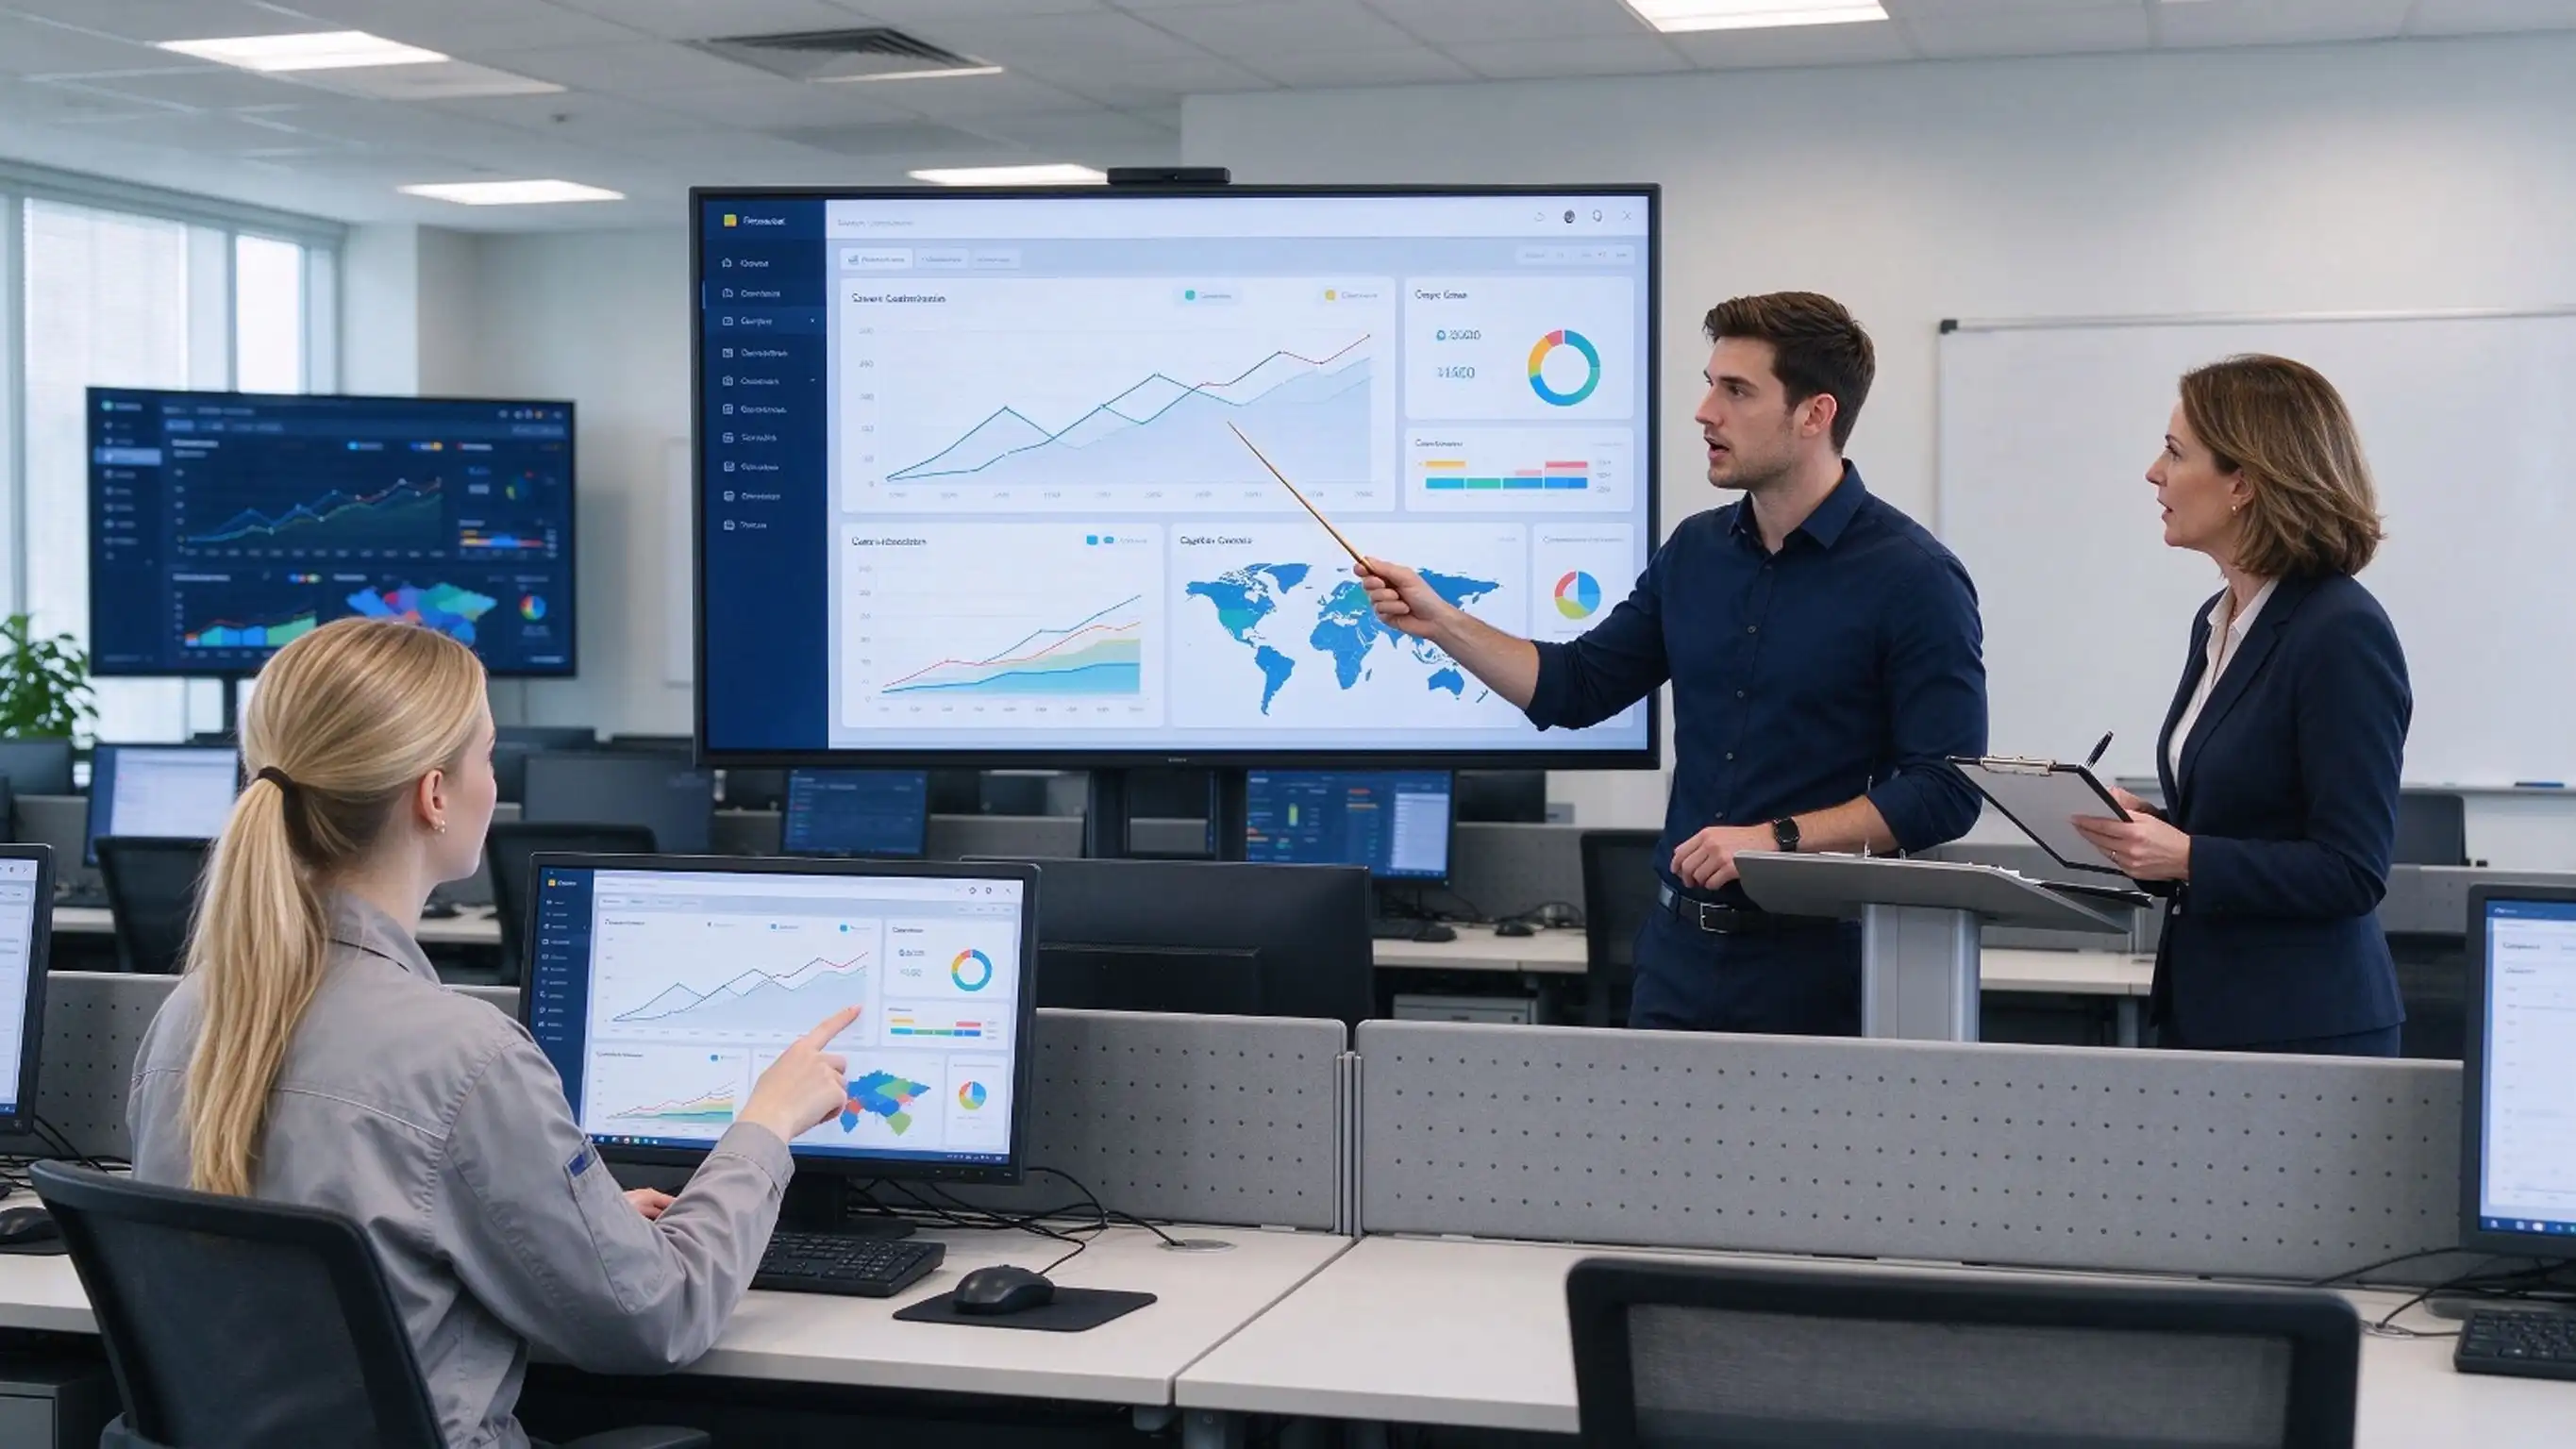
Completeness and clarity are both important in dashboard design. Figure out where decisions need to be made in your workflow. For daily tasks, you need real-time measures like current inventory levels and active campaign success. For strategy reviews, you need trend lines that show monthly growth and comparisons between months and years. Arrange data in a tree-like structure; highlight important KPIs and make related information available through drill-down interactions. Plan your color coding: green means goals were met, yellow means warnings, and red means problems need to be fixed right away. To keep things simple, each view should only show five to seven key metrics. Extra information should be shown on secondary screens. Users can divide data by product type, market, or time period using interactive filters instead of making a lot of basic reports.
Real-World Application Examples
Imagine a medium-sized company selling goods and handling stock in Amazon's warehouses in the US, UK, and Germany. Their dashboard shows the number of stock coverage days by region and shows which products are getting close to needing to be reordered while taking into account the average lead time from suppliers. When a certain SKU's conversion rates drop in Germany, they look into it further and find that a competitor just released a cheaper version of the same product. This sets off an immediate pricing review and adjustment strategy. Also, advertising tools that show ROAS by keyword group make it easy to quickly move budget from terms that aren't working to terms that are, which can increase campaign efficiency by 20 to 30 percent within weeks (eMarketer, 2022). These real-world wins show how visualization speeds up the cycle from idea to action, which is what makes successful sellers successful and unsuccessful ones unsuccessful.
Integrating Analysis into Operational Routines
Adding analytics to daily tasks is what makes society data-driven, not technology alone. Set regular review times: in the morning, go over yesterday's sales and inventory alerts; once a week, look at how well your ads are doing and product trends; and once a month, go over your strategic positioning and how your competitors are changing. Assign clear responsibility: operations managers should keep an eye on fulfillment metrics, advertising specialists should keep an eye on campaign KPIs, and product teams should look at how well the selection process is working. It is also important to make sure that all of your documentation is consistent. This way, everyone on the team will agree on what "good" performance means for each measure. Visualization becomes the common language for continuous improvement when everyone can understand the data and act on it in the same way.
Trends & Future Outlook in Cross-Border E-Commerce Analytics
Emerging Technologies Reshaping Analysis
AI and machine learning are automating more and more routine analysis tasks while finding patterns that humans might miss. Using things like social media sentiment, search trend velocity, and economic indicators along with historical sales data, predictive algorithms can more accurately predict what people will want to buy. With natural language processing, you can ask screens simple questions like "Which products drove growth last quarter?" instead of making complicated filter combinations. Computer vision is used for quality control and visual trend analysis to find out which kinds of product images lead to higher conversion rates. These technologies don't replace human judgment; instead, they improve it. They free up analysts from having to prepare data so they can focus on interpreting it strategically and planning what to do next.
Data Security and Compliance Imperatives
As the flow of data across borders grows, regulations get stricter. The GDPR in Europe, the CCPA in California, and China's Personal Information Protection Law all have strict rules about how to collect, store, and use customer data. Platforms for cross-border e-commerce data analysis & visualization need to secure data while it's being sent and stored, keep records of who read what data when, and give people the option to delete data if they want to. Aside from following the law, keeping data safe also helps businesses stay ahead of the competition. For example, sellers' knowledge about pricing strategies, relationships with suppliers, and product roadmaps is considered valuable intellectual property. If you want your business to last, you have to choose analytics tools with good security credentials and teach your staff how to handle data correctly (World Economic Forum, 2022).
Skills Development as Competitive Advantage
The gap between having access to data and knowing how to use it is both a problem and an opportunity. Companies that make it a habit to improve the critical skills of everyone on their teams get huge benefits. To do this, we need to train more than just a few experts. We need to make sure that everyone in the company understands core measures, that marketing teams can read attribution reports, and that leaders ask questions based on data. Structured training programs that combine understanding of ideas with practice on real-life situations speed up this change. Businesses and educational providers can work together to make customized lessons that fit the needs of each business model, such as B2C brands that want to improve their advertising or B2B distributors that want to make the most of their inventory. The way E.C.R. Academy combines the knowledge of working professionals in the field with the design of academic lessons shows how collaborative models can help organizations of all sizes improve their skills.
Conclusion
Mastering cross-border e-commerce data analysis & visualization is a necessary skill for successful cross-border e-commerce in global markets that are becoming more competitive. Businesses can turn reactive tasks into proactive, strategic ones by collecting, processing, and showing performance data in a planned way. Structured skill development in analytics has clear benefits for everyone, whether you're a business trying to make decisions without relying on experience, a school preparing students for jobs in digital trade, or a service provider improving client deliverables. Now is the perfect time to teach your organization how to use data in a way that promotes growth, efficiency, and a long-term competitive edge across borders. This is because there is easy access to data, tried-and-true methods, and collaborative training models.
FAQ
1.What metrics should beginners prioritize when starting with data analysis?
Before moving on to more complex analyzes, new practitioners should focus on basic operational metrics. To get a sense of basic performance patterns, start with sales volume and revenue trends. Keep an eye on product change to keep your money from getting stuck in stock that doesn't sell quickly. Keep an eye on the conversion rates at every stage of the funnel, from views to clicks to sales, to see where potential customers stop being interested. When it comes to advertising, you should focus on return on ad spend instead of meaningless measures like views. These core signs give you instant insights that you can use, and they also help you develop analytical instincts that will help you later use more complex methods.
2.How can small teams implement visualization without large IT investments?
Teams that want to save money can make good use of free or cheap tools. Google Data Studio lets you make professional graphs and connect to different data sources for free. A lot of e-commerce platforms come with basic analytics that can be used as a starting point. You can export important data to Google Sheets and use the built-in charts to easily keep track of trends. Graduated pricing tiers from SaaS providers let you match your investment to your needs as they change. Starting with clear questions you want to be answered is more important than getting complicated tools and hope they will give you insights.
3.Does the training course support complete beginners?
Of course. The cross-border e-commerce data analysis & visualization course at E.C.R. Academy starts with basic ideas, assuming you don't know anything about analytics before. The project-driven method teaches ideas by putting them into practice. For example, students start by using data collection techniques in real-life platform situations and then work on improving their skills in cleaning, analyzing, and visualizing the data. Template dashboards, case libraries, and step-by-step instructions all help students learn faster and better by providing support. The browser-based tool gets rid of technical problems, so students can focus on learning how to think critically instead of worrying about how to run software. The material is both easy to understand and challenging for both individuals looking to change careers and institutional partners putting together team training.
Elevate Your Team's Data Capabilities with E.C.R Academy
To become a world-class analyst, you need more than just access to software. You need structured learning pathways that are aligned with real-world operational workflows. The cross-border e-commerce data analysis & visualization training that E.C.R. Academy offers is perfect for businesses, schools, and industry partners. Our project-based curriculum, which was made with the help of platform experts and senior teachers, goes over the whole data process, from gathering data to making strategy reports. The browser-based training tool can be used by individuals, groups, or entire organizations without any complicated computer setup. We offer flexible solutions that can be tailored to your needs, whether you're looking for wholesale course licensing, customized corporate training, or white-label curriculum partnerships. Get in touch with us at ecr2008@enteredu.com or check out our full training program at enteredu.com to learn how data-driven transformation can help your cross-border operations and the skills of your workforce.
References
1. eMarketer. (2022). Global E-commerce Forecast 2022.
2. International Trade Administration. (2021). Cross-Border E-Commerce: Understanding Regulatory Challenges. U.S. Department of Commerce.
3. McKinsey & Company. (2022). The Data-Driven Enterprise: How Leading Companies Use Analytics.
4. Statista. (2023). Cross-Border E-Commerce Market Size Worldwide 2020-2027.
5. World Economic Forum. (2023). Data Security and Privacy in Digital Trade.
6. E.C.R Academy. (2024). Cross-Border E-Commerce Data Analysis Training Platform.


_1781601799781.webp)