Why Cross-Border E-Commerce Data Analysis & Visualization Matters
Kufunika kwa kusanthula ndi kuwonetsa deta ya malonda apaintaneti: Today, merchants are dealing with sales, advertising, inventory and taxes across many regions at the same time, and you can’t monitor that volume on instinct alone. Analysis converts raw store and campaign information into clear answers about what to sell, where to spend and what channels are profitable. Visualisation puts the answers on dashboards that a full team can view within minutes. In this tutorial I’ll describe how the process works, how teams learn it, and what to look for in training.
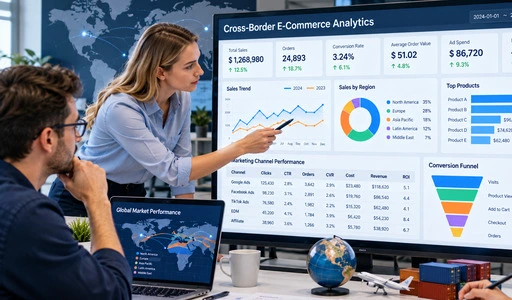
Kumvetsetsa Kusanthula Deta ya Malonda a Pa Intaneti Osiyanasiyana
What the Work Involves
Cross-border e-commerce data analysis is the process of gathering, cleaning and analysing figures from shops, advertising platforms and traffic routes so that a firm may make better choices. A standard evaluation involves traffic, conversion rate, average order value, customer value and profit margin. It also includes market trends, rivals and keywords performance to choose products. Behind those statistics is a lot of activity. UNCTAD’s Digital Economy Report 2024 estimates global e-commerce sales at about $27 trillion in 2022. My perspective on analysis is that it’s a repeatable process: Define the question, collect the data, test the response, document the choice.
Data Sources Cross-Border Teams Work With
Data comes from many areas, and each place addresses a distinct issue. Traffic, orders and conversion are shown in store reports. Advertising dashboards provide keywords, click-through rate (CTR), conversion rate (CVR) and return on investment (ROI). Outside channels (Google search traffic, email marketing (EDM), affiliate program) demonstrate where outside visitors are coming from and how effectively they are buying. Our course teaches learners how to extract data from numerous sources and bring it to a standard format including anomalous values, missing values, and mixed formats. “Clean, consistent data is important because a chart based on mismatched dates or currencies can send a team in the wrong direction.”
Common Problems Without Structured Analysis
Those who don’t use organised analysis generally face the same challenges. Reports are in different folders and nobody sees the whole picture. The real margin of a transaction changes with currency and tax restrictions. For example, the European Union’s VAT e-commerce laws that came into effect in July 2021 removed the import VAT exemption for low-value consignments and created the Import One-Stop Shop. Ad dollars frequently go toward channels that appear crowded but convert badly. There can be a few experienced persons in the team who have the rationale in their brains. Clear reporting and a common metric system remove that dependency and speed up and level reviews.
The Role and Importance of Data Visualization in Cross-Border E-Commerce
Turning Numbers into Pictures
Visualisation puts numbers into charts the eye can read fast. A line illustrates a trend, a bar compares items, a funnel reveals where consumers drop off. Edward Tufte’s book The Visual Display of Quantitative Information says that visuals should be used to clarify facts and not decorative distractions. This advise is immediately applicable to cross-border e-commerce data analysis and visualisation. If it takes a manager 10 minutes to notice an issue, the chart has failed. Good chart selection, simple layout and clear labelling of each indicator allow a visitor to see at a look a decline in conversion or rise in ad spend.
Shared Dashboards for Mixed Teams
Cross-border teams consist of operators, marketers, analysts and managers. Each team analyses data differently. In Information Dashboard Design, Stephen Few defines a dashboard as a presentation of the most critical information needed to achieve one or more objectives; consolidated and displayed on a single screen so that the information can be monitored at a glance. All groups have access to one version of shop performance, advertising results and traffic sources on a single dashboard for kusanthula ndi kuwonetsa deta ya malonda apaintaneti. This cuts down on debates over whose spreadsheet is correct and leads discussions toward choices. In our course, learners create business dashboards and visual reports and present conversion funnels, so they get experience communicating to colleagues in diverse positions.
Reports That Lead to Decisions
A chart is only good if it results in action. A visual report should finish with a recommendation: boost the budget on a keyword with great ROI, or halt a product with a tight margin, or correct a listing with high traffic and poor conversion. In his 2006 Harvard Business Review essay “Competing on Analytics,” Thomas Davenport makes a similar point: organisations win when analysis informs regular choices. This has become a habit with periodic corporate evaluations. The reviewer analyses the outcomes with the previous period, gives the reason and assigns the next step. This is covered in our course by way of company evaluations, strategy improvement and written analysis reports.
How to Effectively Analyze and Visualize Cross-Border E-Commerce Data
Start with Clean Data and Clear Questions
Each study begins with a query. You could want to know why conversion declined last week, or which product line has the greatest margin. Then it comes to data preparation. Collect data from each channel, delete duplicates, fill or flag missing information Set one format for dates, currencies, and metric names This step is a typical source of deceptive charts. I suggest putting down the meaning of each indicator, since "conversion rate" might imply various things in different reports. Clear definitions mean that two analysts will get the same figure from the same data.
Build a Metric System
Reviews are consistent with the metric system. First, I recommend keeping track of three kinds of metrics.
- shop Health: Monitor traffic, conversion rate, average order value and customer value for each shop and market. These numbers tell you whether people are finding your business, if they are buying, and if each purchase is big enough to pay your advertising and fulfilment expenditures. Benchmark each outcome against industry norms for assessment.
- Advertising results: Monitor keyword performance, CTR, CVR and ROI for each campaign. These measurements together tell advertisers whether an ad is getting the correct clicks, if those clicks are leading to orders, and if the advertising is bringing back more than it is costing. Use them to determine whether to continue, change or discontinue campaigns, instead of simply looking at overall expenditure.
- Product and channel outcomes: We choose products based on profit margin, competitive analysis and keyword demand. We also consider traffic quality and ROI for off-site channels such as Google search traffic, email and affiliate programs. By comparing channels side-by-side you can see where to invest the next marketing dollar and which items to stock more heavily.
Combined, these groups include most of the everyday choices made by an operations team.
Choose Charts and Build the Report
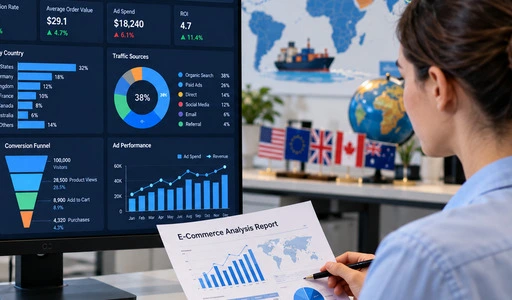
Match the graph to the question in kusanthula ndi kuwonetsa deta ya malonda apaintaneti. Use lines for trends over time, bars to compare items or marketplaces, funnels for the visit-to-order process, and tables for specific figures. Only show the metrics that are relevant to the job on each dashboard, with the most essential measure in the upper left corner. Add a quick summary of the result in one sentence. Export the report in a format that your colleagues can open without extra software. Our course has a platform with visualisation dashboards and report export tools, so this process is practiced by the learners in one spot.
Trends and Future Outlook of Cross-Border E-Commerce Analytics
Faster Data and Automated Reporting
Teams are asking for more and more data on a daily, hourly basis, not a monthly basis. Cloud-based business intelligence (BI) solutions that connect to data sources and update dashboards automatically facilitate this. Gartner assesses these products annually in its Magic Quadrant for Analytics and Business Intelligence Platforms, which indicates that this software category is well established. Automation can eliminate the copy-and-paste job, but it doesn’t eliminate the need for judgement. But someone still needs to assess whether statistic counts and if a rapid shift is a true trend or a data mistake. Training needs to develop the ability.
AI-Assisted Forecasting and Analysis
Artificial intelligence is now included in many analytics programs, whether it be automated warnings on anomalies or demand projections. McKinsey’s 2018 piece “Analytics Comes of Age” examined how sophisticated analytics and machine learning were transforming how firms made choices. These technologies could tell you that sales are going down, or identify a pattern, but it is still humans who define the objective, assess the quality of the data and analyse the outcome. If your data is bad, your prediction is a confident incorrect response . So I put data cleansing and metric knowledge before sophisticated models in any learning strategy.
Skills Teams Will Need
The rare resource is people who can interpret data and act on it. With better tools. Teams require people who can link shop operations, advertising, product selection and reporting. Typical job titles include e-commerce data analyst, advertising operations expert, product selection specialist, international marketing specialist, and information visualisation professional. A learner who can clean data, produce a dashboard and provide a suggestion would fulfil a number of these positions. It’s one thing reading about strategies, but practicing on practical platforms increases that confidence far quicker.
Choosing the Right Cross-Border E-Commerce Data Analysis and Visualization Solution
Software Tools Versus Training
Training and software handle distinct challenges. Free tools like Looker Studio and commercial platforms like Tableau and Microsoft Power BI can pull graphics from linked data. Prices, data caps and sharing possibilities vary, so each team should verify current terms before purchasing. Tools don’t tell you what measure to monitor, how to clean jumbled data or how to transform a chart into a decision. Training fills the void. Any technology is more valuable to teams when its users understand the business questions underlying the data.
What to Check in a Course
There are 5 things I look for while comparing courses. Firstly, does the curriculum cover the whole process from collecting and cleaning to dashboards and review reports? Secondly, does it employ projects for learners to complete actual tasks? Third, who teaches it: practitioners, academics, or both? Fourth, is the learning environment accessible and supportive of cooperation and the language your workforce speaks? Fifth, do the results align with the employment positions you want to fill? Also enquire about data privacy and what data the learners will be using in the course.
How the E.C.R Academy Course Fits
Sukulu ya ECR provides a Cross-Border E-Commerce Data Analysis & Visualisation course based on projects that span the whole e-commerce data pipeline. It focuses on technological standards in international e-commerce and is taught by business practitioners and top academic lecturers. No need to install client, browser-based B/S platform, supports Chinese and English interface, team cooperation. It includes business dashboard, data center, visualisation dashboards, marketing sandbox="allow-scripts allow-same-origin allow-presentation" and report export tools. E.C.R Academy has trained and assessed about 500,000 people throughout China and 28 countries since 2010. The training may be used by enterprises and educational institutions and industry organisations.
Kutsiliza
Kusanthula ndi kuwonetsa deta ya e-commerce yodutsa malire vital because sellers manage sales, advertising, stock and tax implications across numerous regions, and clear data replaces guessing. The paper revealed that analysis starts with clean data and specified indicators for store health, advertising, items and channels. Then, visualisation takes the numbers and makes them infographics and dashboards that mixed teams can understand quickly and utilise in business evaluations. Automation and AI predictions mean data comes quicker, but quality and significance are still judged by humans, thus practical skills are the determining element. Software makes charts. Training shows what questions, measurements, and judgements are behind them. A course that covers the whole process with projects, expert instructors and a browser-based practice platform teaches skills for analytical, operations, advertising and reporting jobs.
FAQ
1.Can beginners learn cross-border e-commerce data analysis?
“Yes. The E.C.R Academy course is designed to teach fundamental principles and includes a step-by-step guide and case-based instruction. If you’re a beginner and want to get into data analytics and visualisation for cross-border e-commerce, you may start with no prior expertise.
2.What data should a team track first?
Start with traffic, conversion rate, average order value and profit margin for each shop. Then add advertising metrics like CTR, CVR, ROI, and then off-site channel outcomes. When each statistic is well defined, the reports are consistent.
3.Which job roles can this training support?
Students may prepare for positions such as e-commerce data analyst, cross-border e-commerce operations expert, advertising operations specialist, product selection specialist, international marketing specialist, and information visualisation specialist.
4.How do learners use the platform?
The platform is browser-based and requires no client install. It allows individual study, guided training and team cooperation, and has both Chinese and English interfaces.
Start a Conversation About Cross-Border E-Commerce Data Analysis & Visualization with E.C.R Academy
Are you a team/school/agency seeking for a kusanthula ndi kuwonetsa deta ya malonda apaintaneti provider that combines project-based practice and education from industry experts/senior teachers? We at enteredu.com Academy would love to talk to you about the alternatives for courses. For more information and to share your aims and team size, please email us at ecr2008@enteredu.com Kapena pitani ententu.com and we'll follow up with next steps.
Zothandizira
1. UNCTAD – Digital Economy Report 2024
2. Harvard Business Review – "Competing on Analytics," 2006
3. Edward Tufte – The Visual Display of Quantitative Information, 2001
4. Stephen Few – Information Dashboard Design, 2013
5. McKinsey & Company – "Analytics Comes of Age," 2018
6. European Commission – VAT E-commerce Rules and One-Stop Shop Guidance, 2021